Herbgrind Part 5: Building a 'Grind
Welcome back to my series of posts on Herbgrind, a dynamic analysis tool that finds floating point issues in compiled programs. The purpose of this series is to explain how Herbgrind works and the principles behind its design. To do that, we started with a simple hypothetical computer called the “Float Machine”, which is just enough to capture the interesting floating point behavior of a real computer, like the one that’s probably sitting on your desk. Now, we’re bringing Herbgrind’s analysis to the real world, making it computable and fast.
![]()
In the last four posts in the series, we built up Herbgrind for the Float Machine, a hypothetical machine which executes floating point programs. We showed that Herbgrind is actually composed of three machines run on top of the float machine, sharing the program.
The first, the Real Machine, computes the program with perfect accuracy, exactly as we would in the pure mathematical real numbers. Then, it compares the final result computed this way to the final result computed by the float machine, using floating point numbers. By measuring the difference between the two outputs, the Real Machine can compute the “floating point error” of the program.
The second machine, the Local Machine, computes each operation in a “locally approximate” way. This means taking exact inputs, and rounding them to floats, and then executing the float operation using them. With this method, the Local Machine can detect at which operations error first appears, so it can start to zero in on the cause of the error. The Local Machine also tracks what outputs these sources of error influence, so that the user doesn’t have to worry about error that doesn’t affect the results they care about.
Finally, the Symbolic Machine tracks how each value in the program was built. This way, when the Local Machine detects error in an operation, they Symbolic Machine can tell the user what operations preceded the error, and thus help the user diagnose and fix the error.
Now that we’ve defined what Herbgrind does in the abstract, it’s time to bring the power of Herbgrind to your desk. To do that, we’re going to enlist the help of one of the most incredible (and at times, infuriating) pieces of software I’ve ever encountered: Valgrind.
What is Valgrind?

A few of you might have encountered Valgrind while debugging C code in a programming class. Its most popular “tool”, Memcheck, is endlessly useful for its ability to diagnose memory errors in programs in unsafe languages like C. But, as I was mostly unaware before starting this project, Valgrind is actually a powerful framework for creating analysis tools.
Valgrind provides an interface for building programs, called “tools”, which analyze a program by running it in a modified environment, and observing parts of its state. Valgrind tools can have their own state, and do pretty much anything they want to the analyzed program. Valgrind operates on program binaries directly, and works across a variety of architectures, making it both portable across systems and relatively language independent.
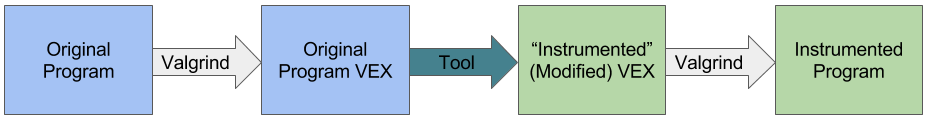
Programs run under Valgrind go through three phases. First, the Valgrind core decompiles the program to a language called VEX, which is a low-level intermediary language just above the machine code, where many compiler details are erased. Then, the Valgrind tool can look at this VEX, insert or remove statements, and even insert runtime calls to tool code. Finally, Valgrind takes the modified VEX, and compiles it back to machine code on the target architecture.
Memcheck and a host of other tools (Cachegrind, Callgrind, Helgrind, etc.) use this interface to produce complex analysis of binary programs.
Writing a Valgrind Tool, 101
A Valgrind tool sits in the middle of the Valgrind pipeline, receiving VEX programs, operating on them, and returning them to the core. But Valgrind doesn’t pass through the whole program at once. Instead, it takes an approach commonly known as “just-in-time compiling”, or JIT compiling. This involves breaking the client program up into pieces, and compiling (or in Valgrind’s case, instrumenting) them as they are needed.
Each of these pieces is what is known in compiler literature as “super blocks”. Super blocks are pieces of code which always start in the same place, and don’t have any internal branches or loops. They do, however, have multiple points where they might exit, depending on some conditions. If that’s confusing, don’t worry: for now, you can just think of them as small pieces of code which don’t do anything tricky like jumping around or changing what they do with an “if” branch. Luckily, Valgrind takes care of the tricky control bits before they reach the tool.
When tool code receives a piece of the client program, it’s in Valgrind’s intermediary language VEX. VEX is kind of like the Float Machine programs we defined in part one of the series, but it handles a lot more of the complexity that you find in real-world machine code. Many of these features are set up to make it more straightforward to think about what the machine is doing on the hardware level. The rest of this post will discuss what programs look like at the VEX level, to set a baseline for implementing the various “machines” that make up Herbgrind. We can understand VEX programs by thinking about a new machine, the VEX machine.
The VEX Machine
Like programs in the Float Machine, each VEX machine superblock has an infinite1 set of numbered slots to store data in. All the operations that the VEX machine does on values directly are done on values in these slots, which are called “temporaries” in VEX terminology. However, the temporaries only exist for as long as that block is running. In a program made up of many blocks, you can’t use temporaries to communicate any information between blocks.
Instead, you need to use one of two other types of storage, which stick around at the end of the super block. These are called “thread state”, and “memory”. Thread state is a small storage set which corresponds to the registers and processor state of the underlying computer. It’s fast to access in practice, but only has a small number of storage slots, so values are being constantly overwritten. It’s generally useful for short term storage between just a few blocks. Memory, on the other hand, is extremely large and can store objects for a long time. The downside is that’s it’s relatively slow to use.
VEX programs are made up of a big list of instructions, much like the Float Machine. One kind of VEX instruction is an operation instruction, like the operation instruction in the float machine. It takes arguments, which can be either constant or values from temporaries, and runs some operation on them, storing the result in a temporary. Since VEX has three different types of storage, there’s another VEX instruction to move values between them. There are also instructions which just store metadata, and some complicated things like conditional exits which we don’t have to worry too much about for now.
But it’ll probably be a lot easier to understand the role that these instructions play if we walk through an example.
A Simple Program in VEX
Let’s look at a simple example VEX program. Let’s say you write the program:
int x = 1;
int y = 2;
int z = x + 3 * y;
The corresponding VEX program might look a little something like this:
------ IMark(0x40080D, 3, 0) ------
STle(11111111111) = 0x01:I64
------ IMark(0x400810, 7, 0) ------
STle(22222222222) = 0x02:I64
------ IMark(0x400817, 7, 0) ------
t1 = LDle:I64(22222222222)
t2 = Mul64(t1, 0x3)
------ IMark(0x40081E, 4, 0) ------
t3 = LDleI64(11111111111)
t4 = Add64(t3, t2)
STle(44444444444) = t4
That’s a lot of dense text… so let’s break it down a bit.
------ IMark(0x40080D, 3, 0) ------
This first line is called an IMark in VEX, for Instruction Mark. Basically, it lets you link the VEX you’re seeing back to instructions in the binary that your tool runs on. This IMark tells you that the VEX instructions that follow, until the next IMark, come from the binary instruction at address 0x400080D. You don’t really need to pay too much attention to these unless you’re debugging a Valgrind tool. But it’s nice to know that for every VEX instruction you deal with, you can trace it back to the binary that the user gave you. If that binary is compiled with debug information, you can even trace it all the way back to the source code!
STle(11111111111) = 0x01:I64
This next line is storing the value \(1\) in memory at location
11111111111. In most architectures, this address wouldn’t make any
sense, but let’s suspend our disbelief for a second here and pretend
it does; the actual memory locations don’t really matter too much. The
right hand side of the equals, 0x01:I64, is a numeric constant in
VEX. It has a value, 0x01, which is specified in hexidecimal. If it
helps, you can just replace this with 1 in your head. It also has a
second part :I64, which tells you what type the value has. In this
case, I64 means a 64-bit integer. There are also types I32 for a
32-bit integer, F64 for a 64-bit float, and others2.
The left side of the equality tells VEX where to put the value. STle
means, “STore Little Endian”, where “Little Endian” is just one of the
ways that computers organize bytes.
Together, these two lines represent the line in the source code:
int x = 1;
Which assigns x to \(1\). When the program is compiled, the variable
x gets given a concrete location in memory, in this example
11111111111.
------ IMark(0x400810, 7, 0) ------
STle(22222222222) = 0x02:I64
These two lines are pretty much the same as the ones above: they store
the value \(2\) (0x02) to the location 22222222222, and correspond
to the C code:
int y = 2;
The simply load the value two into the memory location the compiler
picked for y, 22222222222.
The next seven lines will all be part of the line:
int z = x + 3 * y;
There’s a lot going on in this line: y is being muitiplied by \(3\),
then added to x, then stored in z. Since VEX is much lower-level
than this source code, it uses many statements to accomplish this,
each doing one simple thing.
------ IMark(0x400817, 7, 0) ------
t1 = LDle:I64(22222222222)
First, an IMark, which we can ignore. The next line loads the value
we just stored into the first temporary. The command LDle means
“LoaD Little Endian”, and it grabs a value from memory. In this case,
we’re taking that value and putting it in a temporary. As I explained
above, there are an infinite number of temporaries, and they are
generally used as a “workbench” for values. In this case, we’re
loading this value (x in the C code) up so that we can multiply it
by three.
t2 = Mul64(t1, 0x3)
Here we actually do the multiplication by three. Here, instead of a
fixed command like load or store, we have an operator. Each operator
in VEX has a number of arguments, in this case two, and an operator
code. There’s a big table of operator codes in the primary reference
file for Valgrind tool developers, libvex_ir.h. In this case, we
have the operator for a sixty four bit multiply, which the
pretty-printer helpfully prints for us as Mul64. In between the
parenthesis, we have the two arguments to that operator: the first one
is the temporary we loaded y into in the last line, and the second
one is the constant value \(3\).
Once we finish with the multiply, we want to store it in another
temporary, so that’s what the t2 = part of the line does.
------ IMark(0x40081E, 4, 0) ------
t3 = LDleI64(11111111111)
t4 = Add64(t3, t2)
STle(44444444444) = t4
Okay, let’s try to tackle these last four lines all at once. The first
line is another IMark, which just tells you where the instruction came
from. The second line is another load, which loads x into a new
temporary, t3. The third line is another operation, this time a
64-bit add, which adds the x we just loaded, and the y * 3 we
computed in the last line. Finally, in the last line, we store the
result in memory at 44444444444.
That’s a VEX program, as a Valgrind tool receives it. Hopefully that wasn’t too hard to follow. In this example, I only used integers and integer operations, because those are often simpler. But float operations are pretty much encoded the same way, with just different operation codes, and types.
I also skipped actually showing any thread state in this example,
because I didn’t want to clutter things up with another type of
storage in the first example. Thread state works exactly like memory,
except instead of LDle and STle, we have GET and PUT. Since it
usually represents processor state like registers, when and how it’s
used depends on how your program got compiled to binary.
There are many more details about Valgrind tools operate, but I don’t want to bog you down just yet, so I’ll try to bring them up as they’re needed.

In the next posts, we’ll talk about how we move Herbgrind the abstract analysis to the VEX machine and Valgrind framework, where we can run it on real world computers. Each of the abstract machines we talked about before will work by both transforming the VEX code as it goes through the tool, and adding calls to it’s own code that can keep track of the client program.
-
Well, in theory. In practice, there is a limit, due to some technical limitations of the Valgrind Core. We’ll (hopefully) be discussing this later when I get into some tof the strange obstacles I encountered during the development of Herbgrind. For now though, we can think of the number of temporaries as being infinite. ↩
-
The types given by VEX to data are not exactly like the types you’ll find in a higher level programming language. They are only “correct” (in the sense that an
I64actually holds an integer, and not a floating-point number), at a very local level. While you’ll never see a float operation being run on anI64, VEX programs might put a value into thread state (or memory) as anI64, only to take it out as aF64, sometimes even within the same superblock. In future posts, we’ll explore how Herbgrind layers it’s own type system on top of the one provided by VEX to get a little more precision. But in general, giving types to things at the machine-code level is hard ↩